
Updated
Healthcare Equipment Tracking: The Complete Guide for Hospitals & Clinics
In a Nursing Times survey run with GS1 UK, 37% of nurses said they spend at least an hour of every shift finding equipment, and some reported up to six. GE Healthcare's analysis of 45 US hospitals found that devices per staffed bed climbed from 8 to 13 across roughly a decade, a 62% increase, while service and maintenance cost per bed rose 90%. Hospitals are buying more equipment and spending more to maintain it, and they still cannot find it.
The healthcare RTLS (Real-Time Location Systems) market reached $2.46-3.27 billion in 2024 and is projected to exceed $9.94 billion by 2033. This guide covers everything healthcare organizations need to know about tracking medical equipment, from simple AirTag solutions to enterprise RTLS platforms.
The True Cost of Missing Medical Equipment
Staggering Financial Losses
Almost every dollar figure quoted in this market comes from a company selling tracking. That does not make them all wrong, but it does mean each one needs a name attached. Here is what exists and who published it:
| Claim | Figure | Who published it, and what it is |
|---|---|---|
| Nurse time lost searching | 37% of nurses spend 1+ hour per shift, some up to 6 | Nursing Times with GS1 UK, survey of ~1,000 UK nurses. Independent survey, but UK and dated |
| Nurse time lost searching | 21 minutes per shift | GE Healthcare, "Out of Control". Stated in the paper with no source given |
| US productivity cost | $14 billion a year | Vizzia Technologies with Georgia State University. Vizzia sells RTLS, so this is a vendor estimate |
| Mobile device utilization | 42% | GE Healthcare, from its own proprietary service data, no methodology published |
| Devices per staffed bed | Rose from 8 to 13, up 62% | GE Healthcare. This one has real methodology: 45 US hospitals, 1995-97 compared with 2008-10, regression adjusted |
| Service and maintenance cost per bed | Up 90% over the same period | GE Healthcare, same methodology |
| Equipment shrinkage | About $3,500 per month per department | Cal Poly analysis of 12,000+ VA VISN 10 asset records. The most independent figure available, and it is a dollar amount, not a rate |
Alarming Equipment Loss Rates
This is the number everyone wants and nobody has actually measured.
The claim you will see everywhere is that 10-20% of hospital mobile assets are lost or stolen over their useful life, at $3,000 per item. It traces to one place: an opinion column in Chief Healthcare Executive published in August 2023 by Adrian Jennings, chief product officer at RTLS vendor Cognosos. The column says "research shows" and names no research. Everything downstream cites the column.
The competing vendor numbers do not converge, which tells you more than any one of them does:
- 10% per year, asserted by Midmark RTLS, with a $7 million annual cost for a 300-bed hospital
- 15-35% of total asset costs annually, in one RTLS case study PDF
- 7.2% per year, measured at a single site, Emory Decatur, and reported by its RTLS vendor
- About $3,500 per month per department, from the Cal Poly VA study, the one figure in this list derived from actual asset records rather than an assertion
A range of 7% to 35% is not a benchmark. It is the absence of one. What you can do instead takes an afternoon: pull the variance from your last physical inventory, multiply the missing units by replacement cost, and divide by the fleet value. That is your shrinkage rate, it is specific to your facility, and unlike every number above, you can show your work.
Time Wasted Searching
The productivity impact is the best-evidenced part of this whole subject, because an independent publication surveyed nurses directly rather than modelling it.
- 37% of nurses spend at least an hour per shift finding equipment, and some reported up to six hours (Nursing Times with GS1 UK, around 1,000 UK nurses). The same survey put it at the equivalent of about 40 hours a month
- 21 minutes per shift is the lower figure, from GE Healthcare's white paper, which states it without a source
- The $14 billion annual US productivity cost comes from a Vizzia Technologies and Georgia State University white paper. Vizzia sells RTLS
Watch out for the "6,000 hours" statistic that circulates with these. It originated as 6,000 hours per month per 1,000 nurses and is now routinely quoted as 6,000 hours per year per hospital, which is a different claim by two orders of magnitude.
Equipment Underutilization
Underutilization is the cost people miss, because it never shows up as a loss. It shows up as a purchase order.
GE Healthcare's "Out of Control" analysis is the standard reference here, and it is worth separating its two halves. The part with published methodology compares 45 US hospitals between 1995-97 and 2008-10, regression adjusted, and finds devices per staffed bed rose from 8 to 13, a 62% increase, while service and maintenance cost per bed rose 90%. The part without published methodology is the headline everyone quotes: average utilization of mobile devices is 42%, drawn from GE's own service data with no method given.
Take the 42% as directional rather than exact. The mechanism behind it is not in dispute and is easy to verify in your own building: when staff cannot find a pump, they do not search, they requisition. The fleet grows, utilization falls further, and maintenance cost grows with the fleet. That loop is what the 62% and 90% figures are measuring, and those two do have methodology behind them.
Equipment That Needs Tracking
High-Value Mobile Equipment
Critical Care:
- Infusion pumps and IV poles
- Ventilators
- Patient monitors
- Defibrillators
- Portable X-ray machines
Diagnostic Equipment:
- Portable ultrasound machines
- EKG/ECG machines
- Pulse oximeters
- Portable CT scanners
Patient Transport:
- Wheelchairs
- Stretchers and gurneys
- Patient lifts
- Transport monitors
Support Equipment
Clinical Support:
- Vital signs monitors
- Medication carts
- Blood pressure machines
- Thermometers (especially during outbreaks)
Specialty Equipment:
- Surgical instruments and sets
- Endoscopes
- Physical therapy equipment
- Respiratory therapy devices
Fixed Assets Requiring Tracking
Major Systems:
- HVAC equipment
- Imaging equipment (MRI, CT, X-ray)
- Laboratory equipment
- Sterilization equipment
Facility Equipment:
- Emergency generators
- Boilers and water heaters
- Elevators
- Fire safety systems
Healthcare Tracking Technologies
RTLS (Real-Time Location Systems)
The dominant technology for hospital equipment tracking:
How It Works: Each asset is tagged with a Bluetooth, RFID, or IoT-enabled sensor that continuously transmits location data to a centralized platform, providing instant visibility of every item's location and status.
Technology Options:
| Technology | Precision | Best For | Considerations |
|---|---|---|---|
| RFID (Passive) | Room-level | High-volume tracking | Requires reader infrastructure |
| RFID (Active) | Zone-level | Real-time visibility | Higher tag cost |
| BLE (Bluetooth) | Room-level | Mobile equipment | Smartphone compatible |
| UWB | Sub-meter | Precise positioning | Higher infrastructure cost |
| Wi-Fi | Building-level | Leverages existing network | Lower precision |
Market Dominance:
- RFID segment holds 32.43% market share
- Asset tracking segment: 32.63% of healthcare RTLS market
- Hospitals: 59.68% of total market
CMMS (Computerized Maintenance Management Systems)
For maintenance tracking and compliance:
Key Capabilities:
- Work order management
- Preventive maintenance scheduling
- Asset lifecycle tracking
- Regulatory compliance documentation
- Inventory management
ROI Statistics:
- 200-400% ROI typically achieved in first year
- 15-25% reduction in maintenance costs within 12 months
- 25-40% decrease in unplanned downtime with predictive maintenance
- 60-80% reduction in compliance preparation time
Apple AirTags for Healthcare
AirTags can provide basic tracking for smaller facilities or as backup systems:
Advantages:
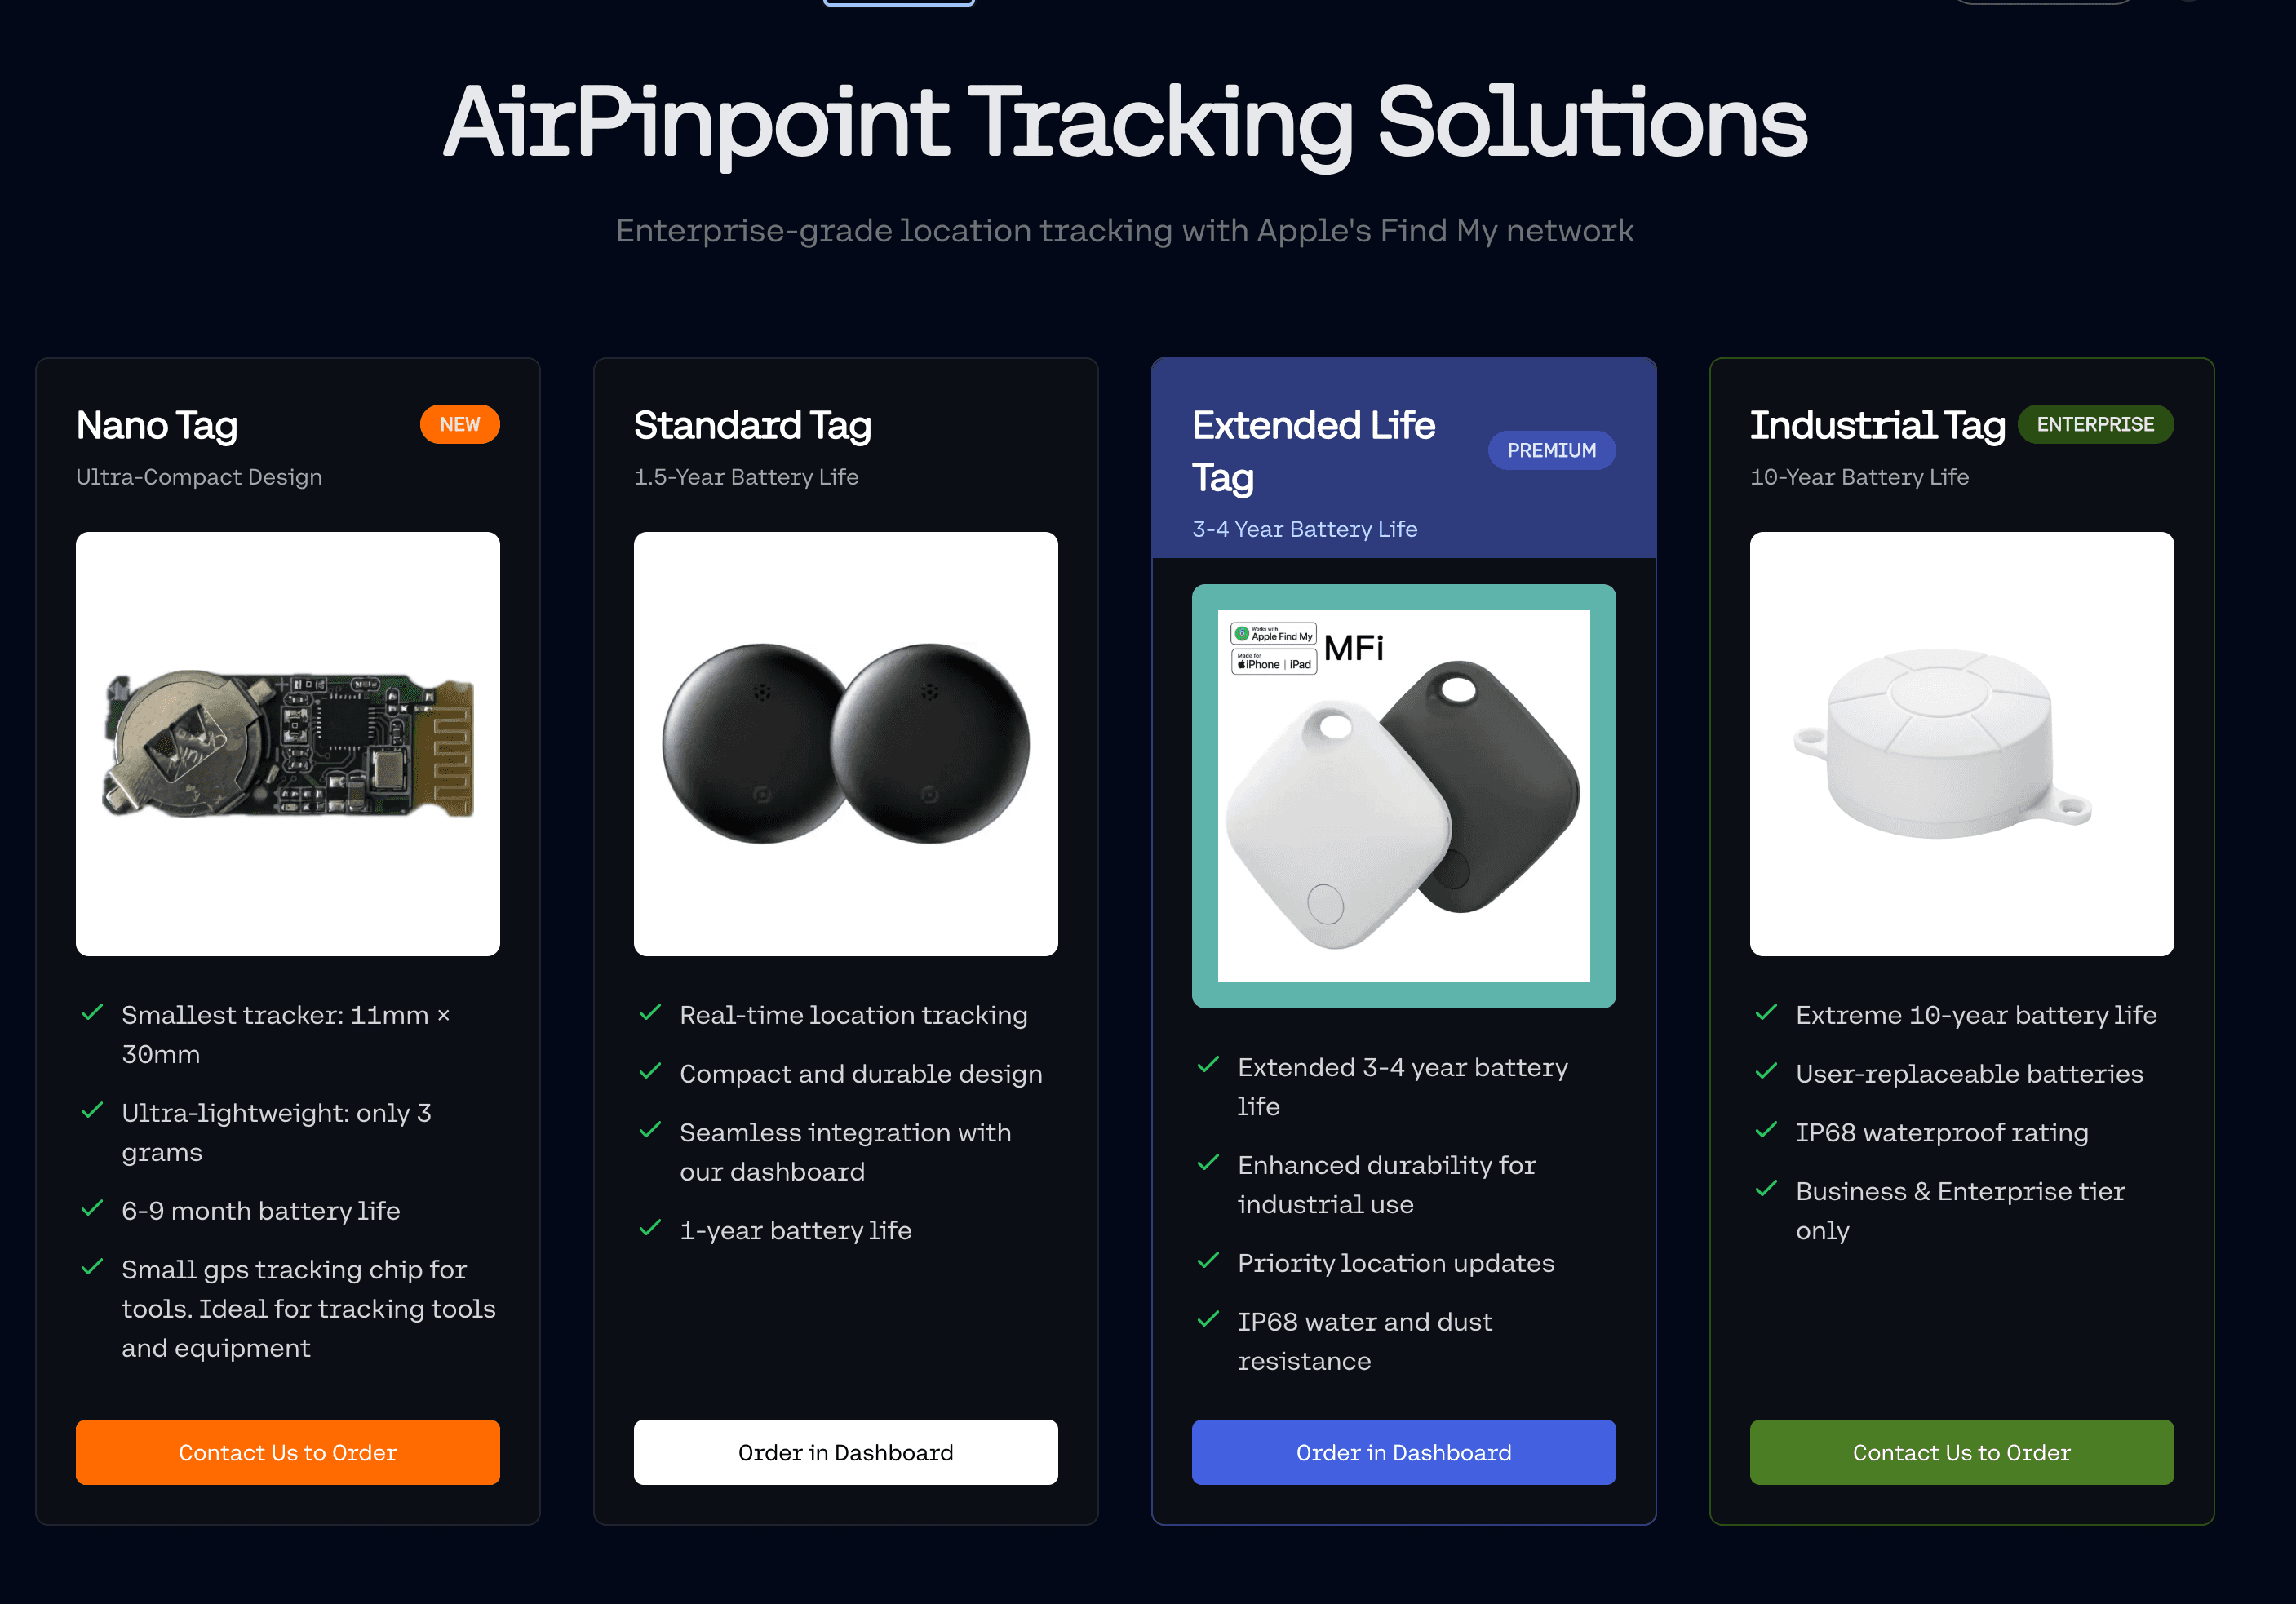
- $29 per tag, no Apple subscription. Airpinpoint plans start at $11.99 per tag per month for the business dashboard, team access, location history, and geofencing.
- 12+ months of battery life on a $1-3 CR2032 coin cell, at full Bluetooth update frequency. No charging, no cables, no maintenance cycle.
- Simple deployment
- Works via Apple's billion-device Find My network
- Updates every 1-5 minutes indoors wherever iPhones are nearby, which in most hospital units is continuously. GPS trackers on unpowered equipment update once a day if they want multi-year battery; AirTags update hundreds of times a day without a recharge in sight.
Limitations for Healthcare:
- Requires Apple devices for tracking
- Indoor precision limited compared to dedicated RTLS (room-level, not bed-level)
- No integration with hospital EMR/EHR systems
- Can't provide room-level accuracy needed for some use cases
- 32 AirTag limit per Apple Account (Airpinpoint removes this limit for fleet deployments)
Best Use Cases:
- Smaller clinics and outpatient facilities
- Home health agency equipment
- Backup tracking for high-value items
- Non-critical mobile equipment
- Long-term care facilities with limited budgets
FDA Compliance Requirements
Medical Device Tracking (21 CFR Part 821)
The FDA requires tracking for certain devices:
Devices Requiring Tracking: Manufacturers must track Class II or III devices if:
- Device failure would likely cause serious adverse health consequences
- Device is implanted for more than 1 year
- Device is life-sustaining or life-supporting outside a facility
Manufacturer Requirements:
- Written standard operating procedures (SOPs)
- Method for tracking throughout distribution
- Quality assurance program with audit procedures
- Audits at least every 6 months (first 3 years), then annually
UDI (Unique Device Identifier) System
FDA-mandated identification system:
- Device-to-manufacturer links for tracking and identification
- All classes of devices must have a UDI
- Enhances post-market surveillance
- Improves recall management
- Supports adverse event reporting
Joint Commission Standards
Compliance Requirements:
- 100% compliance with equipment maintenance required
- Accurate maintenance logs demonstrating regulatory adherence
- Preventive maintenance schedules for all medical equipment
- Documentation of all service and repairs
Cost-Benefit Analysis
Equipment Maintenance Investment
Typical Healthcare Maintenance Costs:
| Metric | Range |
|---|---|
| Equipment as % of capital | 10-15% |
| Maintenance as % of equipment value | 6-10% annually |
| Maintenance cost per bed | $15,000-$25,000 |
| Target equipment uptime | 98-99% |
| PM compliance target | 95%+ |
RTLS/Asset Tracking ROI
Documented Savings:
| Investment | Typical Return |
|---|---|
| CMMS implementation | 15-25% maintenance cost reduction in 12 months |
| Predictive maintenance | 25-40% decrease in unplanned downtime |
| Mobile solutions | 20-30% improvement in technician productivity |
| Remote monitoring | 30-50% reduction in equipment failures |
| Search time reduction | 60-80% improvement |
How the saving actually happens Every figure in the table above is published by a vendor, and none of them shows its method, so use them to understand the mechanism rather than to size a budget. The mechanism is consistent and you can test it in your own building in a day. Pick one equipment class, infusion pumps are the usual candidate. Ask the floor how many are available. Then physically count how many are available. The gap between those two numbers is what tracking closes, and the money it saves is money you do not spend buying units you already own. That is an avoided-purchase saving, not a recovered-asset saving, and it is the reason utilization figures matter more here than theft figures.
Hidden Costs of Poor Tracking
Beyond Direct Equipment Losses:
- Rental equipment costs when owned equipment can't be found
- Emergency purchases at premium prices
- Staff overtime searching for equipment
- Patient care delays
- Compliance penalties
- Insurance claim complications
- Biomedical engineering inefficiency
Implementation by Facility Type
Hospitals (500+ Beds)
Recommended Approach:
- Enterprise RTLS system with full infrastructure
- Integration with EMR/EHR systems
- CMMS for maintenance management
- Predictive maintenance capabilities
- Analytics and reporting dashboard
Investment Range: $500K-$2M+ for full implementation
Expected Savings: $2-5M annually
Mid-Size Hospitals (100-500 Beds)
Recommended Approach:
- Department-specific RTLS deployment
- Cloud-based CMMS
- BLE or RFID tags on mobile equipment
- Integration with existing systems
Investment Range: $100K-$500K
Expected Savings: $500K-$2M annually
Clinics and Outpatient Facilities
Recommended Approach:
- AirTags on high-value mobile equipment
- Airpinpoint dashboard for visibility
- Basic CMMS or spreadsheet tracking
- Barcode-based asset management
Investment Range: $1K-$50K
Expected Savings: $10K-$100K annually
Long-Term Care Facilities
Recommended Approach:
- RFID or BLE tags on shared equipment
- Integration with resident tracking systems
- Simplified CMMS for maintenance
- Focus on wheelchairs, lifts, therapy equipment
Investment Range: $10K-$100K
Expected Savings: One facility saw 30% reduction in lost equipment in 6 months
Home Health Agencies
Recommended Approach:
- AirTags on all portable equipment
- GPS tracking for vehicles (hardwired, not battery-powered)
- Cloud-based asset inventory
- Check-in/check-out procedures
Investment Range: $500-$5K
Note on GPS for equipment: Battery-powered GPS trackers advertise multi-year battery life by updating once a day. For equipment stored in patient homes, that means one location breadcrumb every 24 hours. An AirTag updates whenever an iPhone passes nearby, which in residential neighborhoods happens continuously, and runs 12+ months on a coin cell. For tracking portable equipment in vehicles or at patient homes, AirTags provide more frequent updates at a lower cost per device.
Challenges: Equipment spread across patient homes
Building Your Healthcare Tracking System
Phase 1: Critical Assets ($5K-$25K)
Month 1-2:
- Inventory all mobile medical equipment
- Prioritize by value and frequency of "loss"
- Deploy AirTags or basic BLE tags on highest-value items
- Establish check-in/check-out procedures
- Create basic tracking dashboard
Quick Wins:
- Identify "hoarded" equipment in departments
- Reduce emergency rentals
- Improve response times
Phase 2: Department Rollout ($25K-$100K)
Month 2-6:
- Expand tracking to all mobile equipment
- Implement CMMS for maintenance scheduling
- Establish preventive maintenance protocols
- Train staff on equipment location systems
- Create equipment utilization reports
Expected Results:
- 20-30% reduction in search time
- 15-20% improvement in maintenance compliance
- Identification of underutilized equipment
Phase 3: Enterprise Integration ($100K+)
Month 6-12:
- Deploy comprehensive RTLS infrastructure
- Integrate with EMR/EHR systems
- Implement predictive maintenance
- Establish analytics and reporting
- Continuous optimization
Expected Results:
- 200-400% ROI within first year
- 98-99% equipment uptime
- 25-40% reduction in maintenance costs
Infusion Pump Focus: A Case Study
Infusion pumps represent one of the most commonly "lost" and tracked equipment categories:
Market Overview
- Infusion pump rental market: $379.65 million (2023)
- Projected to reach $567.32 million by 2032
- CAGR: 5.03%
Common Issues
- Pumps "hoarded" by departments
- Equipment believed unavailable when actually available
- Unnecessary rental costs
- Delays in patient care
Tracking Benefits
- Real-time visibility across all units
- Utilization data for right-sizing inventory
- Maintenance scheduling integration
- Reduced emergency rentals
DME (Durable Medical Equipment) Considerations
Fraud and Theft Risks
DME faces unique challenges:
- 28% of all Corporate and Financial Investigations in 2024 involved DME
- $100+ million in fraudulent DME schemes uncovered in 2024 takedown
- Equipment billed but never delivered
- Stolen patient information used for fake orders
Tracking Solutions for DME
Effective DME tracking provides:
- GPS integration from warehouse to patient
- Chain of custody documentation
- Delivery confirmation
- Return tracking
- Usage monitoring
- Maintenance compliance
Choosing the Right Solution
For Budget-Conscious Facilities
Airpinpoint with AirTags:
- $29 per AirTag
- $11.99/device/month, fraction of RTLS cost (volume discounts available for 100+ tags)
- No infrastructure required
- Team access for all staff
- Movement alerts and history
- Works for clinics, small hospitals, home health
For Mid-Size Operations
Hybrid Approach:
- AirTags for basic mobile equipment
- Dedicated RTLS for critical assets
- Cloud-based CMMS for maintenance
- Gradual expansion as ROI proven
For Enterprise Healthcare
Full RTLS + CMMS Integration:
- Complete infrastructure deployment
- EMR/EHR integration
- Predictive analytics
- Comprehensive reporting
- Regulatory compliance automation
Key Metrics to Track
Equipment Utilization
| Metric | Target |
|---|---|
| Equipment uptime | 98-99% |
| Utilization rate | 70-85% |
| Search time | <5 minutes |
| PM compliance | 95%+ |
| Equipment availability | >90% |
Financial Performance
| Metric | Target Improvement |
|---|---|
| Maintenance costs | 25-40% reduction |
| Equipment losses | 50%+ reduction |
| Rental/replacement costs | 30-50% reduction |
| Staff productivity | 20-30% improvement |
Conclusion
Healthcare equipment tracking isn't just about knowing where things are. It's about patient care, staff efficiency, and financial sustainability. The strongest evidence for it is not a dollar figure at all: it is that 37% of nurses spend an hour or more of every shift looking for equipment (Nursing Times with GS1 UK), that devices per staffed bed climbed 62% while service cost per bed climbed 90% (GE Healthcare, 45 US hospitals), and that the two are the same problem seen from different ends.
Build your own case from your own books: last inventory variance times replacement cost, plus rental invoices for equipment you already owned, plus the hours your staff spend searching. Then start small. AirTags on your highest-value mobile equipment through a platform like Airpinpoint costs $29 per tag plus $11.99 per tag per month, which is cheap enough to test on one equipment class before committing to a facility-wide RTLS project.
Be clear on what an AirTag does and does not do here. It gives you building and zone-level location, roughly 10 to 30 meters, not bed-level precision. It does not integrate with your EMR. It reports position, not device status or utilization hours. For a full RTLS replacement in a large hospital it is the wrong tool. For finding out whether you own more pumps than your floor thinks you do, it is enough.
Ready to stop losing medical equipment? Get started with Airpinpoint and track your healthcare assets from one unified dashboard.
 Our Solution


