
Asset Recovery Statistics 2025: Equipment Theft Data & Recovery Rates
Every number on this page names the report it came from and links to it. Where we could not find a real source for a statistic that circulates widely in this industry, we say so instead of repeating it.
The Scale of Equipment Theft in America
The National Equipment Register estimates that $300 million to $1 billion worth of heavy equipment is stolen in the United States each year. NER words it as an estimate and attaches no methodology to it, which is worth knowing before you quote it: the true figure is unknowable because thefts go unreported and many reports lack an identifiable machine.
What is counted is smaller and firmer. The NER/NICB 2016 Equipment Theft Report logged 11,574 equipment theft reports submitted to the National Crime Information Center in one year. That report is the backbone of most of the figures below.
A survey of around 1,000 construction managers by the Chartered Institute of Building found that nearly a third experienced theft on their sites every week, which is the difference between theft as an event and theft as an operating cost.
The hard truth: most stolen equipment is never recovered. NER/NICB recorded 2,442 recoveries against those 11,574 thefts, a recovery rate of 21 percent.
Equipment Theft by the Numbers
Annual Loss Statistics
| Metric | Value | Source |
|---|---|---|
| Annual equipment theft value | $300M to $1B (estimate) | National Equipment Register |
| Equipment thefts reported to NCIC, 2016 | 11,574 | NER/NICB 2016 Equipment Theft Report |
| Recoveries reported, 2016 | 2,442 | NER/NICB 2016 Equipment Theft Report |
| Average cost per incident | $30,000 (estimate) | National Equipment Register |
| Share of new equipment budget spent replacing lost or stolen items | 25% | Samsara, State of Connected Operations 2026 (n=1,500+ executives) |
| Share of theft and loss cost from assets worth under $10,000 | 72% | Samsara, State of Connected Operations 2026 |
That last row is the one most people get wrong. The budget damage is concentrated in cheap, portable assets, not in the excavator everyone worries about.
Recovery Rates
| Asset class and data source | Recovery rate |
|---|---|
| Heavy equipment (NER/NICB, 2016) | 21% (2,442 of 11,574) |
| All stolen property by value (FBI UCR Table 24, 2019) | 28.9% ($3.9B of $13.3B) |
| Powered hand tools (Metropolitan Police, London, Jan 2019 to May 2021) | 1% |
| Building materials (same Met Police dataset) | 4% |
The London tool figures come from a Freedom of Information request to the Metropolitan Police covering 32,067 stolen powered hand tools. They are UK data and they are police-recorded recoveries, so informal recoveries are missing. We include them because they are the only hard tool-specific recovery numbers published anywhere, and because the direction is unambiguous: the smaller the asset, the worse the odds.
What we will not tell you: that tracking produces a 90 percent recovery rate. That number circulates constantly. It traces to LoJack's own product marketing for its radio-frequency stolen vehicle recovery system, where it is backed by a warranty that refunds the purchase price of the unit if a vehicle is not recovered within 24 hours. It is a vendor claim about one product, not a measured recovery rate for tracking in general, and no independent study establishes one. Anyone quoting you a recovery percentage for Bluetooth tags is making it up.
Most Commonly Stolen Equipment
From the NER/NICB 2016 Equipment Theft Report, based on all 11,574 theft reports submitted to NCIC:
| Equipment Type | Share of Thefts |
|---|---|
| Mower, riding or garden tractor | 41% |
| Loader (all subclasses) | 18% |
| Tractor (compact, utility, agricultural) | 14% |
| Utility vehicle | 7% |
| Excavator | 4% |
| Forklift | 3% |
Within the loader category, skid steers are 70 percent and backhoes are 22 percent. The top five types account for 84 percent of all losses, the same share as in 2015.
The high mower share surprises people. NER notes it directly: commercial riding mowers are included, and their volume compresses the percentage of every other category. It is a reminder that theft data reflects what is out there and easy to take, not what is most expensive.
NER's analysis of why: value is the primary driver, except for machines too large to move on a small trailer. Large excavators are valuable but seldom stolen because moving one is a logistics problem. Skid steers are the opposite, and skid steer loaders account for more than 36 percent of new construction equipment financed in the US over the preceding five years.
A separate dataset worth reading alongside it is LoJack's 2015 Construction Equipment Theft Recovery Report, which breaks down the equipment LoJack recovered: towables including generators, air compressors, cement mixers and welders at 33 percent, wheeled and tracked loaders at 28 percent, and skid steer loaders at 20 percent. These are recovery shares from one vendor's customer base, not national theft shares, and they get misquoted as the latter constantly.
Most Targeted Brands (NICB Data)
From the same NER/NICB 2016 report, by number of thefts reported to NCIC:
- John Deere: 2,420 thefts
- Kubota: 1,315 thefts
- Bobcat: 882 thefts
- Caterpillar: 773 thefts
- Toro: 368 thefts
NER cautions against reading this as a statement about the brands. Its own note: the list does not follow market share, and these manufacturers make the most compact and therefore most easily stolen equipment. All makes of off-road equipment ship with little or no standard security.
Geographic Theft Patterns
Equipment theft is concentrated. From the NER/NICB 2016 report:
| State | Thefts (2016) | % of 11,574 reports |
|---|---|---|
| Texas | 2,375 | 21% |
| North Carolina | 796 | 7% |
| Florida | 763 | 7% |
| California | 694 | 6% |
| Georgia | 577 | 5% |
The top five states account for 45 percent of all thefts and the top ten account for 63 percent. Nine of the 2016 top ten were also in the 2015 top ten, so this is a stable pattern rather than a one-year spike.
NER's reading is that theft levels correspond to the amount of equipment in an area, and that organized theft rings develop where there is both a high concentration of machines and a large market of used-equipment buyers. It also flags a second effect: theft hot spots appear when a region goes through an industrial boom and equipment volume jumps ahead of site security.
Tool Theft Statistics
Tools are a separate problem from equipment, and almost all of the rigorous data on them is British, because the UK has insurer-funded surveys and police FOI responses that the US does not.
- 32,067 powered hand tools were stolen in the Metropolitan Police area between January 2019 and May 2021, against 2,993 non-powered hand tools. Thieves were 10 times more likely to take a powered tool (Construction Index / Herts Tools FOI)
- Only 1 percent of those powered tools were recovered. Building materials were recovered 4 percent of the time
- 0.3 percent of London tool thefts resulted in a charge, across 34,712 tools reported in 2021 to 2022 (Met Police data)
- 25,525 tool thefts were recorded across 29 UK police forces in 2024, down 18 percent year on year, totalling about £40 million, with an average of £1,565.02 per theft (Direct Line for Business, from Freedom of Information requests to 45 forces)
- 89 percent of UK tradespeople have experienced theft or crime, and 34 percent say it affected their mental health (NFU Mutual)
For the United States, there is no equivalent. Federal crime reporting has no tools category, so there is no national US figure for power tool theft volume or recovery rate, and any page that gives you one without naming a source has invented it. The Samsara executive survey cited above is the closest available US-weighted measure, and it approaches the problem from the budget side rather than the crime side: 25 percent of new equipment budget goes to replacing stolen or lost items.
The True Cost of Theft
Direct replacement cost is the part you can look up. It is rarely the part that hurts.
Direct Costs
- Equipment replacement: the NER estimate is $30,000 for the average incident
- Tool replacement: UK police data puts the average tool theft at £1,565
- Insurance deductible: whatever yours is, and for small tools the loss often falls entirely under it
Indirect Costs
- Project delays: daily penalties and lost revenue, set by your contract
- Operator downtime: crew paid while the work is stopped
- Rental substitution: the weekly rate for a replacement machine, times the weeks you wait
- Insurance consequences: premium changes and, after repeat claims, the risk of non-renewal
- Bonding impact: claims history feeds into surety capacity
- Administrative time: police reports, insurer paperwork, serial number hunting
We are not going to hand you a multiplier here. The honest version is arithmetic on your own numbers, and it takes five minutes:
- Replacement cost of the asset
- Plus the rental rate for a substitute times the weeks until you get one
- Plus crew hours paid while the job is stopped, at your loaded labor rate
- Plus your deductible if you claim, or the full loss if you do not
- Plus any liquidated damages a schedule slip would trigger
Run that once for the most valuable machine on your yard. The result is the number worth comparing against a tracking budget, and it is a number you can defend to your CFO because you built it.
Recovery Time: With vs. Without Tracking
Without Tracking
- Discovery happens whenever someone notices, which on a weekend theft is usually Monday morning
- The police report says the yard was full Friday and empty Monday
- Without a location, there is nothing for an officer to act on
- Recovery rate: 21 percent for heavy equipment, 1 percent for power tools in the London data
With GPS/Bluetooth Tracking
The mechanism, not a percentage. A tracked asset produces a location trail. That converts a report about a missing machine into a report with an address in it, and an address is something a detective can get a warrant for. That is what happened in Howard County: the tags did not recover anything by themselves, they gave police somewhere to go.
Documented recovery, with sources:
- Howard County, Maryland, 2024: a Virginia carpenter placed AirTags in his larger tools after two break-ins. After the third, he followed the signal to a storage facility. Detectives executed search warrants at 12 locations and recovered roughly 15,000 construction tools valued at an estimated $3 million to $5 million, identifying 155 victims (Howard County Police, Washington Post)
- Diamond Landscapes, Kentucky: recovered $500,000 in new trucks and trailers by passing telematics location data to law enforcement (Verizon Connect, the vendor's own case study)
What actually shortens the gap between theft and recovery:
- After-hours movement alerts: the difference between finding out at 2am and finding out Monday
- Geofencing: an alert when an asset leaves an authorized area. On Airpinpoint, a confirmed geofence alert typically lands 15 to 40 minutes after the asset leaves, because it waits for consecutive readings rather than firing on a single stray one
- Location history: a trail of timestamped positions is more useful to an investigator than a single current pin
- A serial number inventory you can produce immediately: NER's own analysis names missing or inaccurate ownership records as a leading cause of the low recovery rate
An honest limit: a Find My tag reports a position when an Apple device passes near it. On a busy street that is constant. In a rural outbuilding it may be hours or days. Accuracy is roughly 10 to 30 meters, which is address level, not shelf level. And recovery runs through the police. We have no law enforcement partnerships and cannot make a case move faster.
ROI of Equipment Tracking
Payback Period
The only third-party survey data we can point to is about GPS fleet telematics, not tags, and we would rather say that plainly than borrow its numbers. From Verizon Connect's Fleet Technology Trends Report, based on an independent survey of more than 800 fleet professionals across 10 industries:
- About one-third of GPS fleet tracking users reported positive ROI in under six months
- 80 percent of fleet professionals now use GPS fleet tracking, up 11 percentage points year over year
- 44 percent of GPS tracking users reported improved productivity
We have no published payback figure for Airpinpoint and will not invent one. Here is the calculation instead, with the inputs you already have:
- Annual cost: $29 per AirTag once, plus $11.99 per tag per month for the Airpinpoint dashboard. For 50 assets that is $1,450 in hardware and $7,194 a year in subscription
- Against: last year's write-offs for lost and stolen assets, plus deductibles paid, plus hours per week spent looking for things times your loaded labor rate
If you have never totalled the first column, that is the more useful exercise. Most operations discover the recurring small losses outweigh the one memorable large one, which matches the Samsara finding that 72 percent of theft and loss cost sits in assets worth under $10,000.
Cost Savings Beyond Theft Prevention
Fleet telematics surveys report savings that a Bluetooth tag cannot deliver, and it matters that you know which is which before you build a business case.
| Benefit | Reported figure | Applies to a Find My tag? |
|---|---|---|
| Fuel, accident, labor and maintenance costs | Average decreases of 11 to 19% (Verizon Connect) | No. A tag has no engine data and no driver behavior data |
| Improved productivity | 44% of GPS tracking users report it (Verizon Connect) | Partly. Less time hunting for assets is real; route and dispatch optimization is not something a tag does |
| Maintenance scheduling on engine hours | Telematics feature | No. A tag reports position, not engine hours, and does not read a machine's ECU |
| Knowing where an asset is and where it has been | The thing a tag actually does | Yes |
Documented Case Studies
We have no published Airpinpoint case studies, so the ones below are other companies' documented recoveries, named and linked so you can check them.
- Howard County, Maryland, 2024: roughly 15,000 stolen tools worth an estimated $3 million to $5 million recovered after AirTags in a carpenter's toolkit led detectives to 12 storage locations (Howard County Police)
- Diamond Landscapes, Kentucky: $500,000 in trucks and trailers recovered via fleet telematics location data. Owner Chris Trower's point in the writeup is worth more than the dollar figure: insurance would have covered the vehicles eventually, but waiting on an adjuster would have taken the company off the road (Verizon Connect)
Both are outcomes from a location trail. Neither is a promise that you will get the same result.
Insurance Benefits
Twelve US states require insurers to offer a discount for approved anti-theft devices on comprehensive coverage. Published discount ranges run roughly 5 to 25 percent off the comprehensive portion of a premium, varying by carrier and device type, and carriers generally require proof of active installation.
Two caveats before you budget for it. First, these programs are written for vehicles and for approved stolen vehicle recovery systems, so a Bluetooth tag on a generator may not qualify at all. Second, the discount applies to the comprehensive portion, not the whole premium, which makes the dollar effect smaller than the percentage suggests. Ask your carrier what specifically qualifies before you count it as savings.
AirTag Success Stories
The Howard County case is the best documented AirTag recovery in this industry, and it is worth reading in full because of what it shows about the mechanism.
A carpenter in Virginia had his van broken into twice. He put AirTags inside his larger tools. On 22 January 2024 the van was hit a third time, and he followed the tags on his phone to a storage facility in Howard County, Maryland. He did not recover anything himself. He handed police a location. Detectives then executed search warrants at 12 locations, 11 of them in Howard County, and recovered roughly 15,000 construction tools stolen from retail stores, businesses, vehicles, homes and job sites across Maryland, Virginia and Pennsylvania. Police valued the haul at $3 million to $5 million, identified 155 victims, and returned their property. One man was indicted (Howard County Police, Washington Post).
The transferable lesson is not that AirTags recover tools. It is that a tag in a large item that a thief does not think to check turns a break-in into an investigable lead. The carpenter had been robbed twice with nothing to show for it. The third time he had an address.
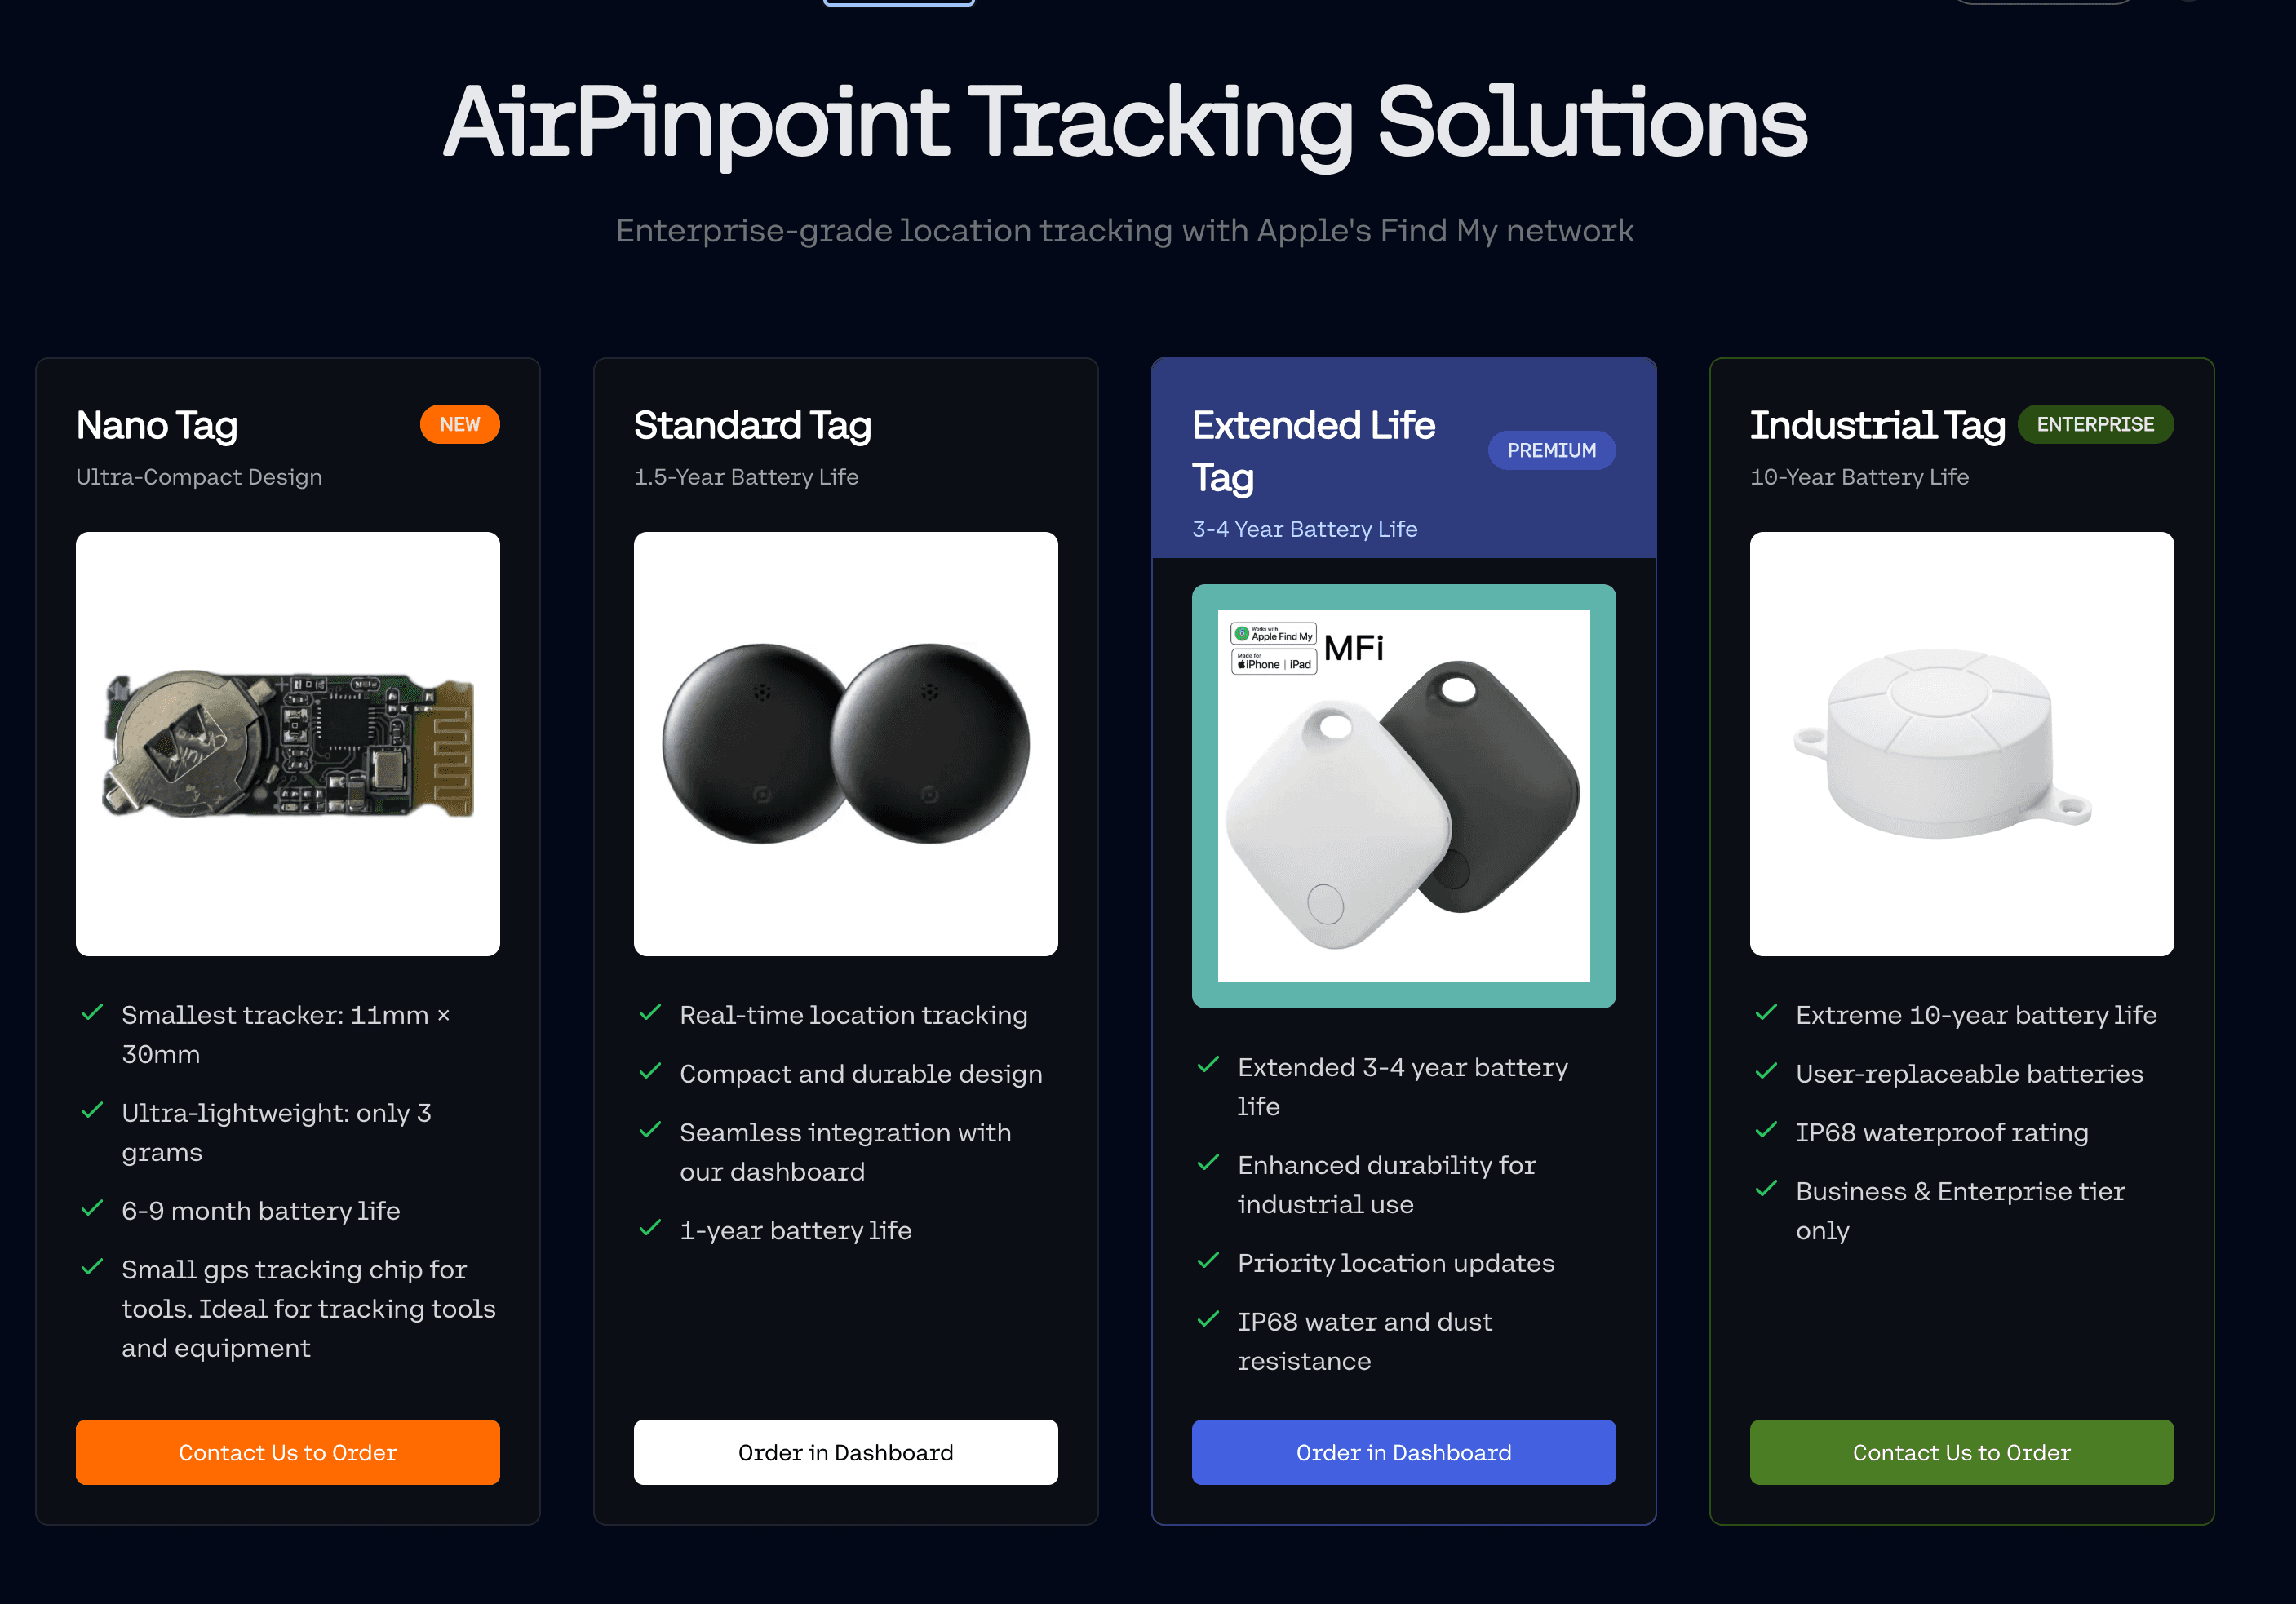
At $29 per device AirTags carry no Apple subscription. Airpinpoint adds a monthly subscription for business features: a dashboard for the whole fleet, location history, geofences with email, Slack and WhatsApp alerts, webhooks, a REST API, CSV and JSON export, and team permissions. That keeps coverage viable on assets that will never justify a $30 per month cellular GPS subscription.
Prevention Best Practices
Physical Security
- Fence job sites and lock gates, since NER's insurance loss data shows most equipment theft happens on other people's premises rather than on the insured's own yard
- Add motion-sensor lighting and alarms
- Use anti-theft devices: fuel cutoffs, hydraulic bypasses, wheel and track locks
- Never leave keys in equipment
- Stage machines so they cannot be dragged straight onto a trailer, which is NER's own recommendation
- Never leave equipment on trailers overnight
Tracking Technology
- Put cellular GPS on machines whose value justifies a monthly subscription per unit
- Put Bluetooth tags on the long tail: tools, generators, attachments, trailers, anything under $10,000 where per-unit GPS economics do not work
- Turn on geofence alerts for the yard and for each active site
- Accept that a tag is a location device. It will not tell you a pump is overheating
Operational Controls
- Keep a serial number inventory you can hand to police the same day. NER names inaccurate or nonexistent ownership records as a leading cause of the 21 percent recovery rate
- Register equipment with the National Equipment Register so a recovered machine can be matched back to you
- Photograph machines and record PINs and VINs before they go out
- Reconcile the inventory on a schedule, not after an incident
- Report every theft to police and to NER, including the ones you write off, because an unreported theft is invisible in NCIC and cannot be matched
Employee Practices
- Background checks for staff with equipment access
- Named accountability for checked-out equipment, so the question is who has it rather than where is it
- Make reporting suspicious activity easy and unpunished
- Brief crews on which assets are tagged and which are not, and on what to do if a tag shows movement
The Bottom Line
The sourced picture is this. US heavy equipment theft losses are estimated at $300 million to $1 billion a year. In the one year with a detailed public breakdown, 11,574 thefts were reported and 2,442 machines came back, a 21 percent recovery rate. For power tools in the best UK dataset available, the recovery rate is 1 percent. And 72 percent of the cost of theft and loss sits in assets worth under $10,000, which is exactly the class of asset most operations never tag.
What tracking changes is narrow and real: it puts an address in a police report. It does not guarantee recovery, it does not read a machine's ECU, and nobody has published a recovery rate for Bluetooth tags, including us.
The arithmetic worth doing is your own:
- Last year's write-offs for lost and stolen assets, plus deductibles paid
- Plus crew hours per week spent searching, at your loaded labor rate
- Against $29 per tag once and $11.99 per tag per month
If the first column is larger, tag the fleet. If it is not, do not. That is a decision you can make from your own books rather than from someone else's percentage.


 Our Solution